CC Catalog Data Visualization - GitHub Open Source Contribution
Introduction
Creative Commons (CC) is a United States-based nonprofit 501(c)3 organization that provides open content copyright licenses, public domain tools, and resources on copyright and information literacy in the digital age. Our free, easy-to-use copyright licenses provide a simple, standardized way for all creators, authors, and producers of knowledge assets and cultural works to give the public permission to share and use their works on conditions of their choice. CC licenses work in tandem with copyright, allowing creators to easily and legally change copyright terms from the default of “all rights reserved” to “some rights reserved” to best suit their needs.
Project Synopsis
Currently CC Catalog data visualization is messy when all the nodes and edges plot all together. So far I observe that we require some sort of filter features which will help to analyse the graph visually and data can be analysed with better insight using the concepts of graph theory metrics, with all this we require live updating of data also.
By considering all this problems my proposal idea’s is given below : -
1. A web based dashboard which will contain several filter options that should help to analyse the graph in a better way. This will filter the graph network by selecting appropriate nodes and/or edges based on the queries.
2. Developed an interactive user interface which filters the network in real time.
3. Live updating of Visuals can be achieved by providing an upload file option that will upload a latest json file on the server and that will be used for further visualisation queries. This is the most simple and straightforward solution I have included alternate approaches also to solve this in further sections.
This is just an overview of my ideas. The detailed explanation is provided below. :)
Project Plan
The Problem #1
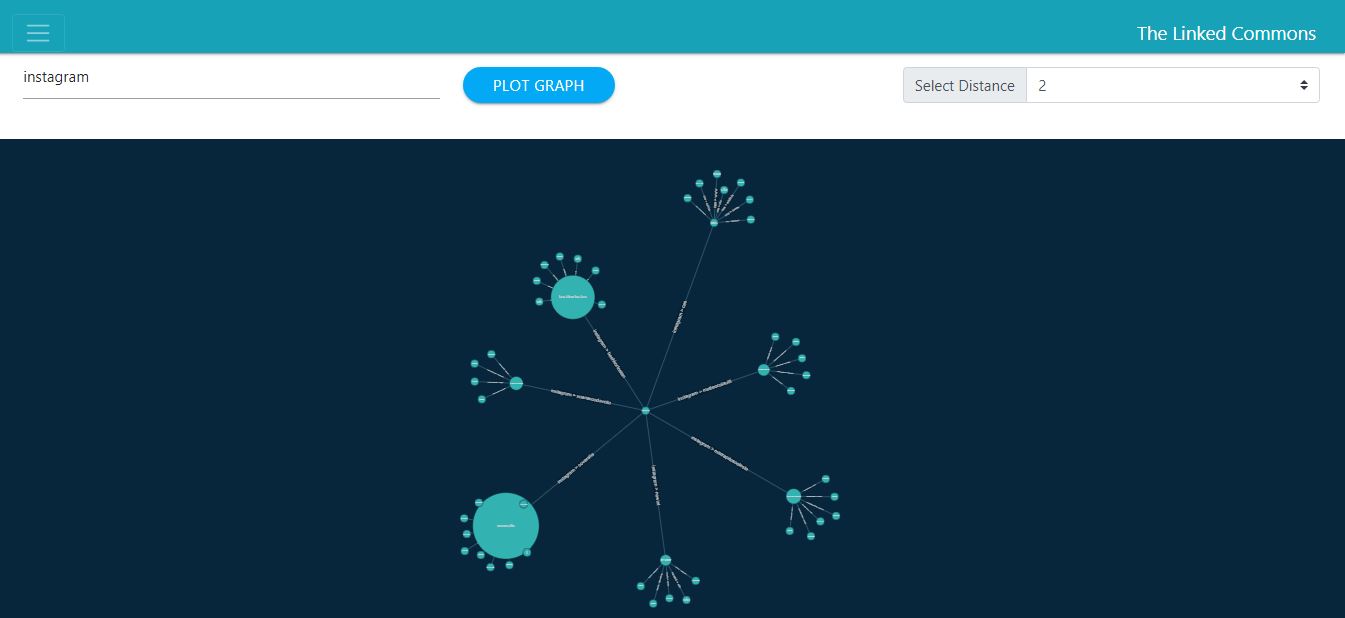
Add filtering by node and distance to the link commons.
Note:
(filter can be given on the basis of Id/ domain_name/ country etc. all the attributes that are provided in the json file are considered to be part of the filter query).
I have already implemented a solution for this problem. I am going to briefly explain the idea behind my implementation and its methodology. And how this solution is efficient for rendering as well as optimization point of view.
The Solution #1
Adding a node filter will lead to analyse the particular domain/node with better visualization. The main thing here to focus on is that cc dealing with large no. of nodes and links so the time complexity of all the algorithms which are going to be implemented must be optimized enough.
So, I came up with an algorithm which will filter the node by their domain name and go only the particular distance/depth as selected by the user with only O(N+M) time complexity where N, M are no. of nodes and edges respectively.
So, I came up with an algorithm which will filter the node by their domain name and go only the particular distance/depth as selected by the user with only O(N+M) time complexity where N, M are no. of nodes and edges respectively.
Everytime time fetching data from the json file for every filter query is not feasible, so for better optimization we will create graph data structure as the user session starts and that data structure will be used for further filter queries. (It will save time for fetching data every time from a json file).
Graph Data Structure : -
I have created an adjacency map, which will contain a list of nodes which are maps with other nodes from which they are connected.
Example: -
Suppose there are 4 nodes. (A,B,C,D)
A is connected to B with weight 40 and C with weight 60, B is connected to D with weight 20. So the adjacency map will look like this.
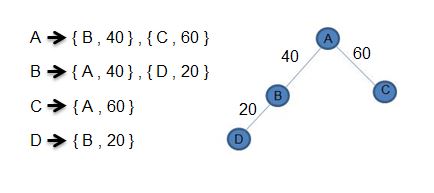
Hence this data structure is implemented by creating a Map() in Javascript. And this will be used for all other filter queries.
Every node in this graph is an object containing details about that domain.
Every node in this graph is an object containing details about that domain.
Graph Node:
cc_licenses : Array of licenses.
id : string obtained from provider domain.
Images : integer number.
licenses_qty : integer number.
node_size : integer number.
provider_domain : string denotes provider domain url.
id : string obtained from provider domain.
Images : integer number.
licenses_qty : integer number.
node_size : integer number.
provider_domain : string denotes provider domain url.

Note:
If the graph is considered to be directed at that time “this.AdjList.get(v).push([u,weight]);” line will be deleted
At same time we have to look toward one more data structure (queue) which will help us to traverse the graph when a particular filter query is fired. That traversal will be achieved by BFS which is explained in detail in the next section.
Queue Data Structure : -
A queue is a linear data structure which follows a FIFO order in which the operations are performed. Follow the FIFO rule (first in first out).
A queue is a linear data structure which follows a FIFO order in which the operations are performed. Follow the FIFO rule (first in first out).

Now, I am going to discuss the main algorithm which will play a role for filtering out all domain names with particular depth/distance.
Algorithm name : BFS (Breadth First Search)
So the crux idea behind this algorithm is it will start traversing the graph from the queried domain and assign its distance to 0 as initial condition. Then visits all it’s neighbours level by level by assigning distance one more then parent node distance. Hence from this it can traverse the whole graph by assigning distances and terminates as soon as it crosses the queried distance.
This algorithm has time complexity of O(N+M) where N and M are no. of nodes and edges respectively. This algorithm is fast enough such that it will easily handle the analysis with large no. nodes with an approx upper bound limit to 10e5 nodes. (where e denotes the exponent)
Example: (BFS Traversal on sample graph data structure)

After traversing, all the traverse data provided to d3 force graph framework for visualization task.
Also d3 force graphs have many visualisation graphics that will be implemented for a user friendly system.
Also d3 force graphs have many visualisation graphics that will be implemented for a user friendly system.
The Problem #2
Live updating of visulization
The Solution #2
The data is monthly collected by Common Crawl and it generates the data in the form of an s3 bucket that further filters out to convert into TSV files. Now TSV file will be pruned to json file for passing it to d3 force graph. This task is already implemented by mentors. The enhancements in this is: -
This problem is resolved by providing the user an option of uploading a latest “fdg_input_file.json” file.
The file upload option is only accessible to only admins as ordinary users have no access to this option. To solve this, whenever a user clicks on the upload file option one pop up form will be shown where the admin will fill the details and authenticate himself to gain access. (This can also be more secured by adding php sessions for whenever admin authenticates successfully).
JSON file is stored on a server with proper name convention such that users get access to previous month data and also compare the previous month data with current month.
Example: - fdg_input_file_MM_YYYY.json format
Note: - user can upload the file with any name. The name formatting will be done on the backend through JS and PHP.
Admin have the access to a list of json files uploaded till date with timestamp and switch between any month for analysis purpose. This task is achieved by just traversing through file names as we are having file names as per proper timestamp format. Also users can compare the domain on the basis of months too.
Alternate approach is we can upload a TSV file then the conversion of TSV to JSON file is done on the backend side. This task is achieved only if we are capable of running a python program on the server so that we need some kind of python framework that will help to build web pages for ex. Django and Flask.
Alternate approach is automatic update from the s3 bucket directly. Common Crawl produces the data every month so we can get the url of the data that is produced by common crawl and using node.js api such that it has an inbuilt library to deal with s3 bucket.
Now to develop this task with more automaticity at that time we can create a web bot that will try to web scrape the Common Crawl website and whenever the changes detected it will fetch the s3 bucket url and just pass this to node.js for further procedure.

Graph Theory Metrics.
In this section I'll provide all the features that will be part of the dashboard for data visualisation, with every feature there is an inference which will help to make decisions and analyze the graph with better insights.1.Analysis on Community or Clustering Detection.
Inferences: -
a) Listing all communities.
b) Sorting community on the basis of size.
c) GT Metrics for each community.
b) Sorting community on the basis of size.
c) GT Metrics for each community.
Implementation: -
This task is the same as finding connected components from the graph. This is achieved by BFS Traversal and will list out the details of n sub-graphs separately where n is the number of connected components in the graph which directly represents the number of communities.
Hence further we maintain the size value of each community such that we sort the communities with respect to size value in decreasing order such that we observe the top community which is responsible for large network existence.
Here size value represents the number of nodes belonging to that community.
Javascript inbuilt sort function is enough to implement sorting which provides O(nlogn) time to sort.
2.Sorting on the basis of Degree value and Plotting Degree Distribution Graph / Bar Graph.
This will help to analyze the connection of a particular domain and provide the list of all domains that are linked to that domain. After that we can visualize the most valuable or famous domains in the graph.
We need one traversal to count all links that are connected to each node. Then this data will pass to high charts because that provides inbuilt features of the bar graph. The implementation remains almost the same as plotting pie charts.
Note :- ZOOM this file to have a more clear view of the image.
Currently all the 50 nodes out of 379 nodes are linked exactly with the 10 other nodes that how the data is pruned. When the graph contains uneven connections at that time the bar graph will help to compare top domains in the network.

Note :- ZOOM this file to have a more clear view of the image.
Currently all the 50 nodes out of 379 nodes are linked exactly with the 10 other nodes that how the data is pruned. When the graph contains uneven connections at that time the bar graph will help to compare top domains in the network.
Currently all the 50 nodes out of 379 nodes are linked exactly with the 10 other nodes that how the data is pruned. When the graph contains uneven connections at that time the bar graph will help to compare top domains in the network.
References and Research
Graph algorithms with optimize implementation: -
http://cp-algorithms.com/
Gephi is one of the most popular tool to analyze the graph. (We can provide same functionality given in this section)
https://gephi.org/features/
Linking S3 bucket to node.js
https://docs.aws.amazon.com/sdk-for-javascript/v2/developer-guide/s3-example-creating-buckets.html
Common Crawl
https://opensource.creativecommons.org/blog/entries/cc-catalog-leverage-open-data-1/
https://commoncrawl.org/the-data/tutorials/
https://opensource.creativecommons.org/blog/authors/soccerdroid/
My PR Link.
CC Organisation Link.
Discussion with @mentor Ari Madian, Brent Moran, Maria Belen Guaranda
Discussion with @mentor Brent Moran
http://cp-algorithms.com/
Gephi is one of the most popular tool to analyze the graph. (We can provide same functionality given in this section)
https://gephi.org/features/
Linking S3 bucket to node.js
https://docs.aws.amazon.com/sdk-for-javascript/v2/developer-guide/s3-example-creating-buckets.html
Common Crawl
https://opensource.creativecommons.org/blog/entries/cc-catalog-leverage-open-data-1/
https://commoncrawl.org/the-data/tutorials/
https://opensource.creativecommons.org/blog/authors/soccerdroid/
Github and PR link -
My PR Link.
CC Organisation Link.
Discussion with @mentor Ari Madian, Brent Moran, Maria Belen Guaranda
Discussion with @mentor Brent Moran
Snapshot and Live Demo
I have hosted a demo project on a free server for reviewing it in a better way.
http://cc-catalog-dataviz.000webhostapp.com/


Comments
Post a Comment